Decorations
North arrows, scale bars, borders, graticules and legends are on by default and shared across
plot(), choropleth(), relief() and study_area(). Each accepts a bool, a style
name, or a dict for full control.
import acadgis as agis

gdf = agis.load_boundaries("Bangladesh", "district")
agis.plot(
    gdf,
    north_arrow={"style": "rose", "size": 0.13, "loc": (0.9, 0.85)},
    scale_bar={"style": "stepped", "length_km": 100, "units": "km"},
    border={"style": "checker"},
    graticule=True,
    legend=True,
)
North arrows
Four styles, all aspect-corrected so they never stretch on tall or wide maps:
classic · minimal · pointer · rose
agis.plot(gdf, north_arrow="rose")
agis.plot(gdf, north_arrow={"style": "minimal", "size": 0.1, "loc": (0.92, 0.9)})
agis.plot(gdf, north_arrow=False)   # turn it off
![]()
Scale bars
simple · bar · stepped, in kilometres or miles:
agis.plot(gdf, scale_bar={"style": "stepped", "length_km": 50, "units": "km"})
agis.plot(gdf, scale_bar={"style": "bar", "units": "mi"})
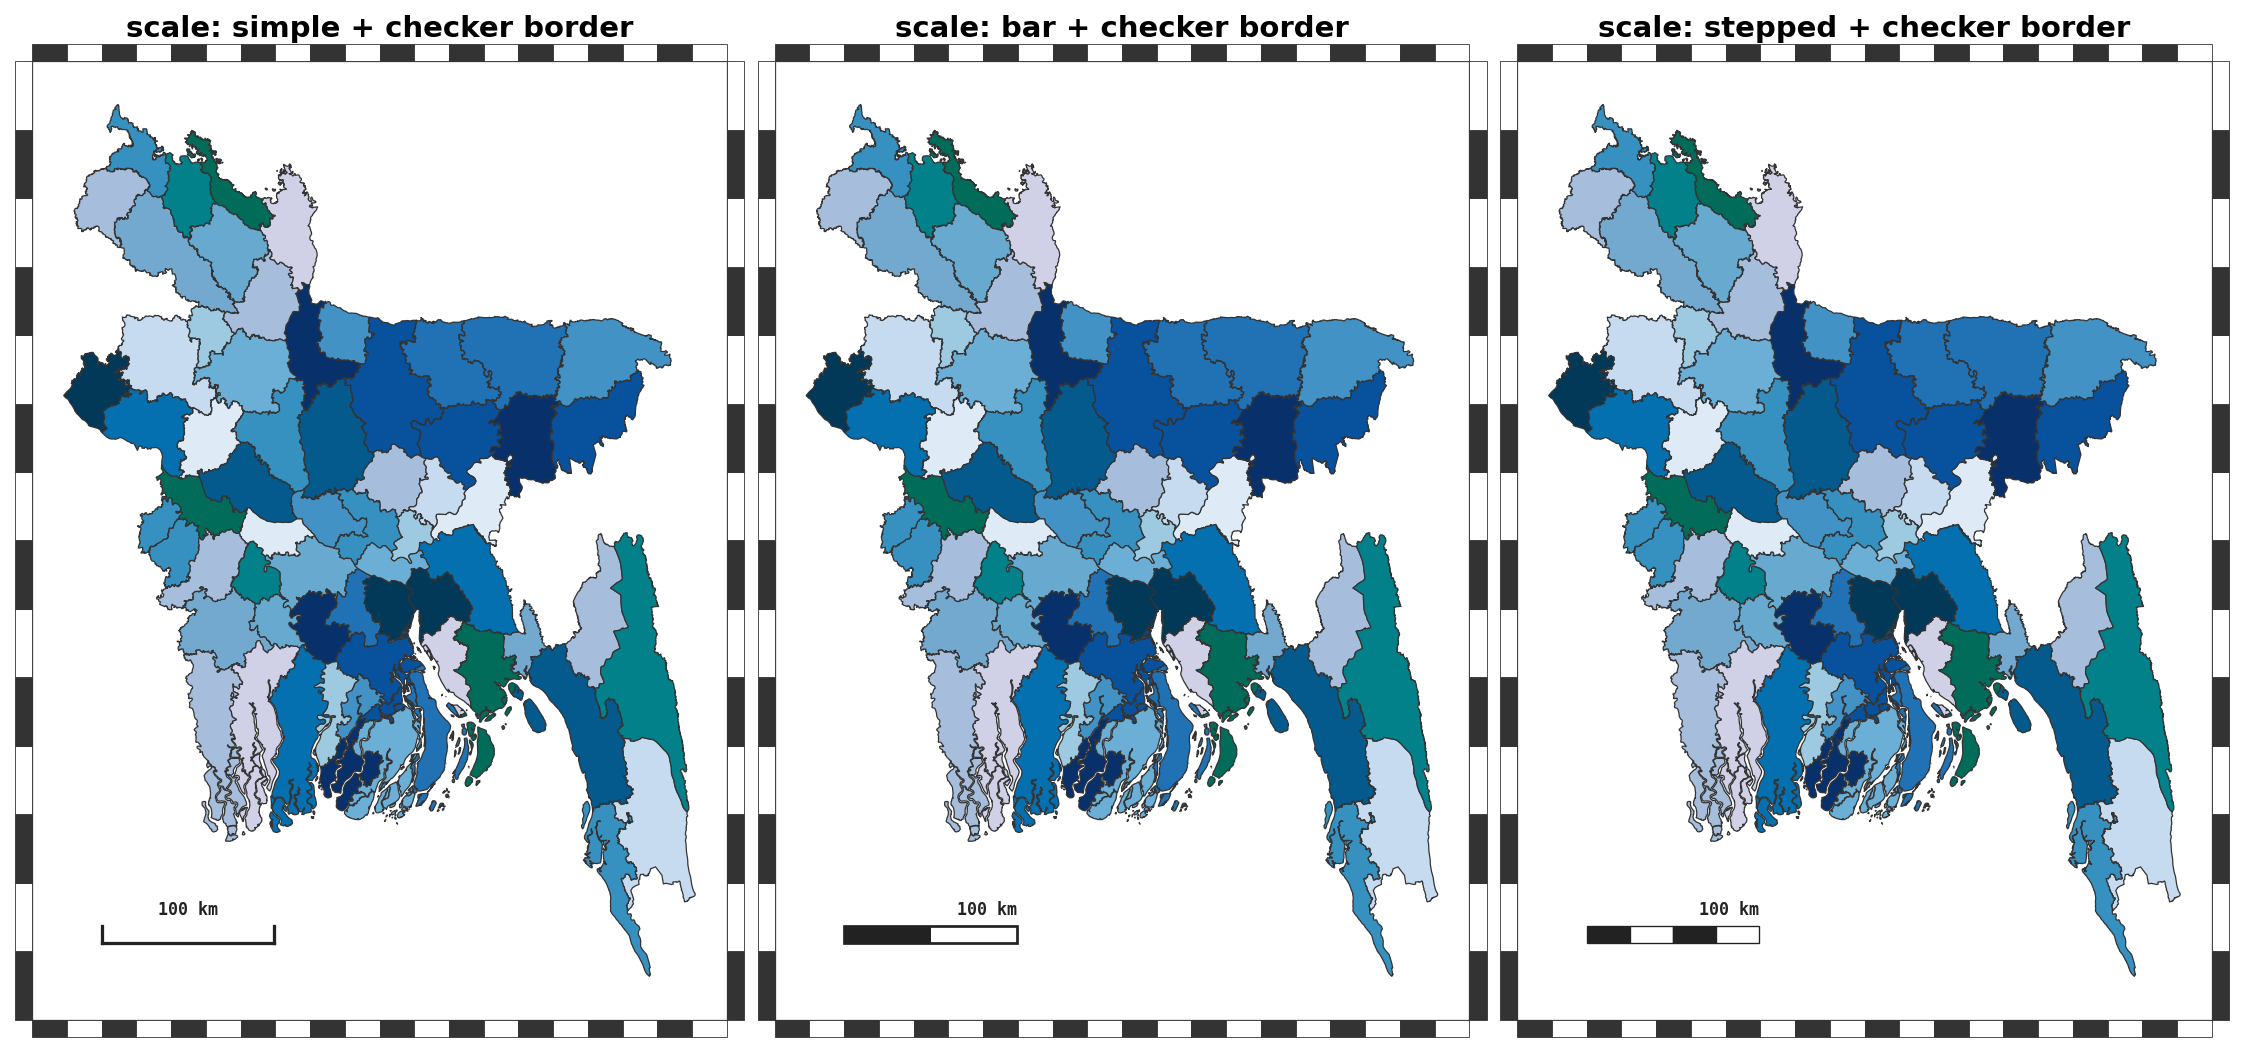
Borders
solid · checker (zebra) · none:
Graticule
Latitude/longitude grid with an optional interval in degrees:
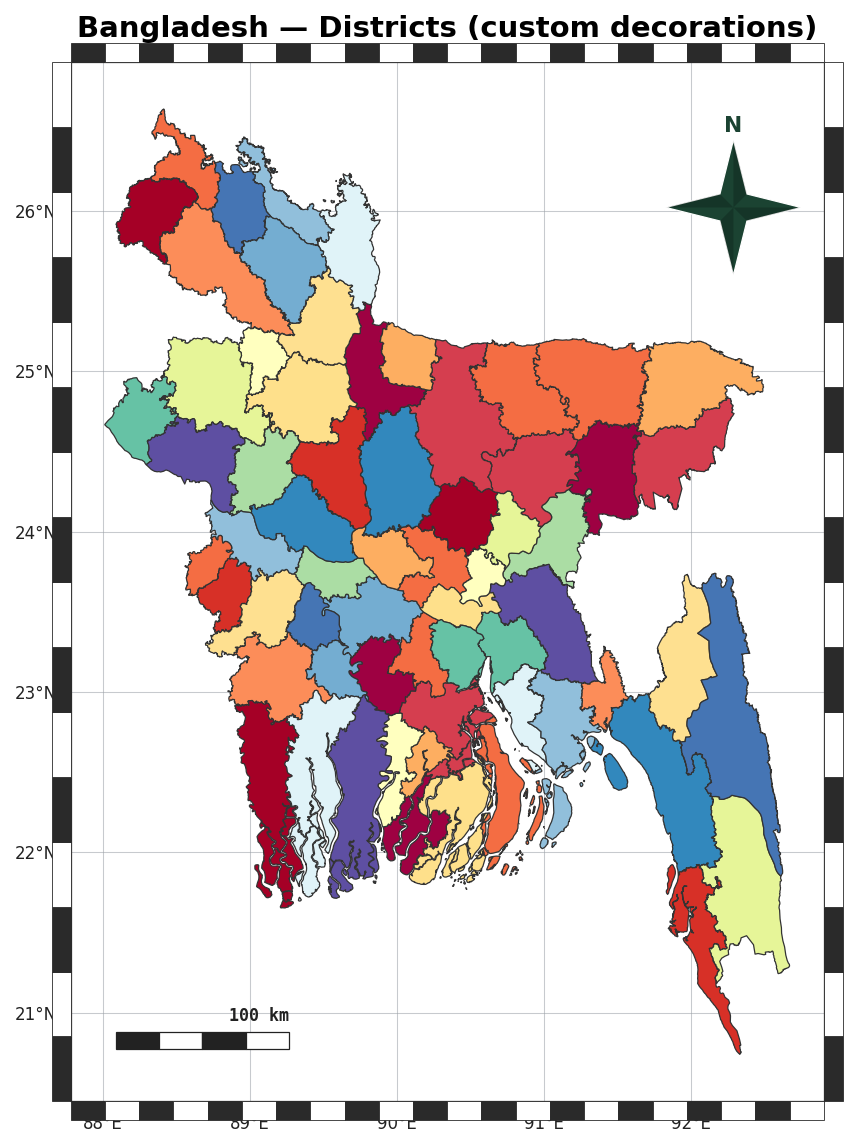
Everything together
agis.plot(
    gdf, palette="spectral", title="Bangladesh — Districts",
    north_arrow="rose", scale_bar="stepped",
    border="checker", graticule=True, legend=True,
)
Per-panel control in study-area figures
In study_area() every decoration argument also accepts a list — one
value per panel — so you can, for example, turn the grid off on just the focus map.